Bar chart made in Altair with Financial Times style
#30DayChartChallenge #Day24 Themeday: Financial times
import pandas as pd
import altair as alt
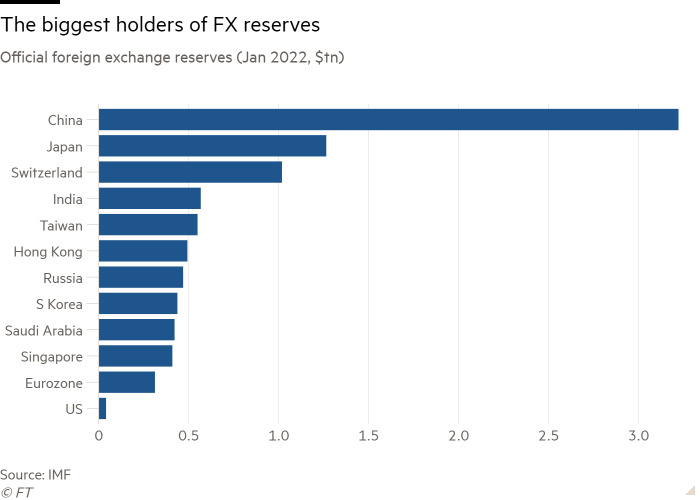
The #30DayChartChallenge Day 24 calls for Financial Times themed charts. The bar chart that I will try to reproduce in Altair was published in the article: "Financial warfare: will there be a backlash against the dollar?"
This is the graph (without FT background) to we want to reproduce:

I digitized the heights of yhe bars with WebplotDigitizer:
data = """Bar0, 3.23
Bar1, 1.27
Bar2, 1.02
Bar3, 0.570
Bar4, 0.553
Bar5, 0.497
Bar6, 0.467
Bar7, 0.440
Bar8, 0.420
Bar9, 0.413
Bar10, 0.317
Bar11, 0.0433"""

data_values = [float(x.split()[1]) for x in data.splitlines()]
I put the values into a Pandas dataframe:
source = pd.DataFrame({
    'label': ['China', 'Japan', 'Switserland', 'India', 'Taiwan', 'Hong Kong', 'Russia', 'South Korea', 'Saudi Arabia', 'Singapore', 'Eurozone', 'US'],
    'val': data_values
})
Now we build the graph and alter it's style to resemble the Financial Times style:
square = alt.Chart().mark_rect(width=80, height=5, color='black', xOffset=-112, yOffset=10)

bars = alt.Chart(source).mark_bar(color='#174C7F', size=30).encode(
    x=alt.X('val:Q', title='', axis=alt.Axis(tickCount=6, domain=False, labelColor='darkgray'), scale=alt.Scale(domain=[0, 3.0])),
    y=alt.Y('label:N', title='', sort=alt.EncodingSortField(
            field="val:Q",  # The field to use for the sort
            op="sum",  # The operation to run on the field prior to sorting
            order="ascending"  # The order to sort in
        ), axis=alt.Axis(domainColor='lightgray',
                         labelFontSize=18, labelColor='darkgray', labelPadding=5,
                         labelFontStyle='Bold',
                         tickSize=18, tickColor='lightgray'))
).properties(title={
      "text": ["The biggest holders of FX reserves", ],
      "subtitle": ["Official foreign exchange reserve (Jan 2022, $tn)"],
      "align": 'left',
      "anchor": 'start'
    },
    width=700,
    height=512
)

source_text = alt.Chart(
    {"values": [{"text": "Source: IMF, © FT"}]}
).mark_text(size=12, align='left', dx=-140, color='darkgrey').encode(
    text="text:N"
)

# from https://stackoverflow.com/questions/57244390/has-anyone-figured-out-a-workaround-to-add-a-subtitle-to-an-altair-generated-cha
chart = alt.vconcat(
    square,
    bars,
    source_text
).configure_concat(
    spacing=0
).configure(
    background='#fff1e5',
).configure_view(
    stroke=None, # Remove box around graph
).configure_title(
    # font='metricweb',
    fontSize=22,
    fontWeight=400,
    subtitleFontSize=18,
    subtitleColor='darkgray',
    subtitleFontWeight=400,
    subtitlePadding=15,
    offset=80,
    dy=40
)

chart
The chart looks quit similar to the original. Biggest difference is the typography. The Financial times uses its own Metric Web and Financier Display Web fonts and Altair can only use fonts available in the browser.
The fonts could be made available via CSS:
@font-face {
    font-family: 'metricweb';
    src: url('https://www.ft.com/__origami/service/build/v2/files/o-fonts-assets@1.5.0/MetricWeb-Regular.woff2''
);
}
from IPython.display import HTML
from google.colab.output import _publish as publish
publish.css("""@font-face {
    font-family: 'metricweb', sans-serif;
    src: url('https://www.ft.com/__origami/service/build/v2/files/o-fonts-assets@1.5.0/MetricWeb-Regular.woff2') format('woff2');
}""")
square = alt.Chart().mark_rect(width=80, height=5, color='black', xOffset=-112, yOffset=10)

bars = alt.Chart(source).mark_bar(color='#174C7F', size=30).encode(
    x=alt.X('val:Q', title='', axis=alt.Axis(tickCount=6, domain=False), scale=alt.Scale(domain=[0, 3.0])),
    y=alt.Y('label:N', title='', sort=alt.EncodingSortField(
            field="val:Q",  # The field to use for the sort
            op="sum",  # The operation to run on the field prior to sorting
            order="ascending"  # The order to sort in
        ), axis=alt.Axis(domainColor='lightgray',
                         labelFontSize=18, labelColor='darkgray', labelPadding=5,
                         labelFontStyle='Bold',
                         tickSize=18, tickColor='lightgray'))
).properties(title={
      "text": ["The biggest holders of FX reserves", ],
      "subtitle": ["Official foreign exchange reserve (Jan 2022, $tn)"],
      "align": 'left',
      "anchor": 'start'
    },
    width=700,
    height=512
)

source_text = alt.Chart(
    {"values": [{"text": "Source: IMF, © FT"}]}
).mark_text(size=12, align='left', dx=-140, color='darkgrey').encode(
    text="text:N"
)

# from https://stackoverflow.com/questions/57244390/has-anyone-figured-out-a-workaround-to-add-a-subtitle-to-an-altair-generated-cha
chart = alt.vconcat(
    square,
    bars,
    source_text
).configure_concat(
    spacing=0
).configure(
    background='#fff1e5',
).configure_view(
    stroke=None, # Remove box around graph
).configure_title(
    font='metricweb',
    fontSize=22,
    fontWeight=400,
    subtitleFont='metricweb',
    subtitleFontSize=18,
    subtitleColor='darkgray',
    subtitleFontWeight=400,
    subtitlePadding=15,
    offset=80,
    dy=40
)

chart
For the moment the font does not look at all to be Metric web :-(
A second minor difference are the alignment of the 0.0 and 3.0 labels of the x-axis. In the orginal, those labels are centered. Altair aligns 0.0 to the left and 3.0 to the right.